POPVOX expenditure trend scan
Early signs of AI tool adoption in House of Representatives spending.
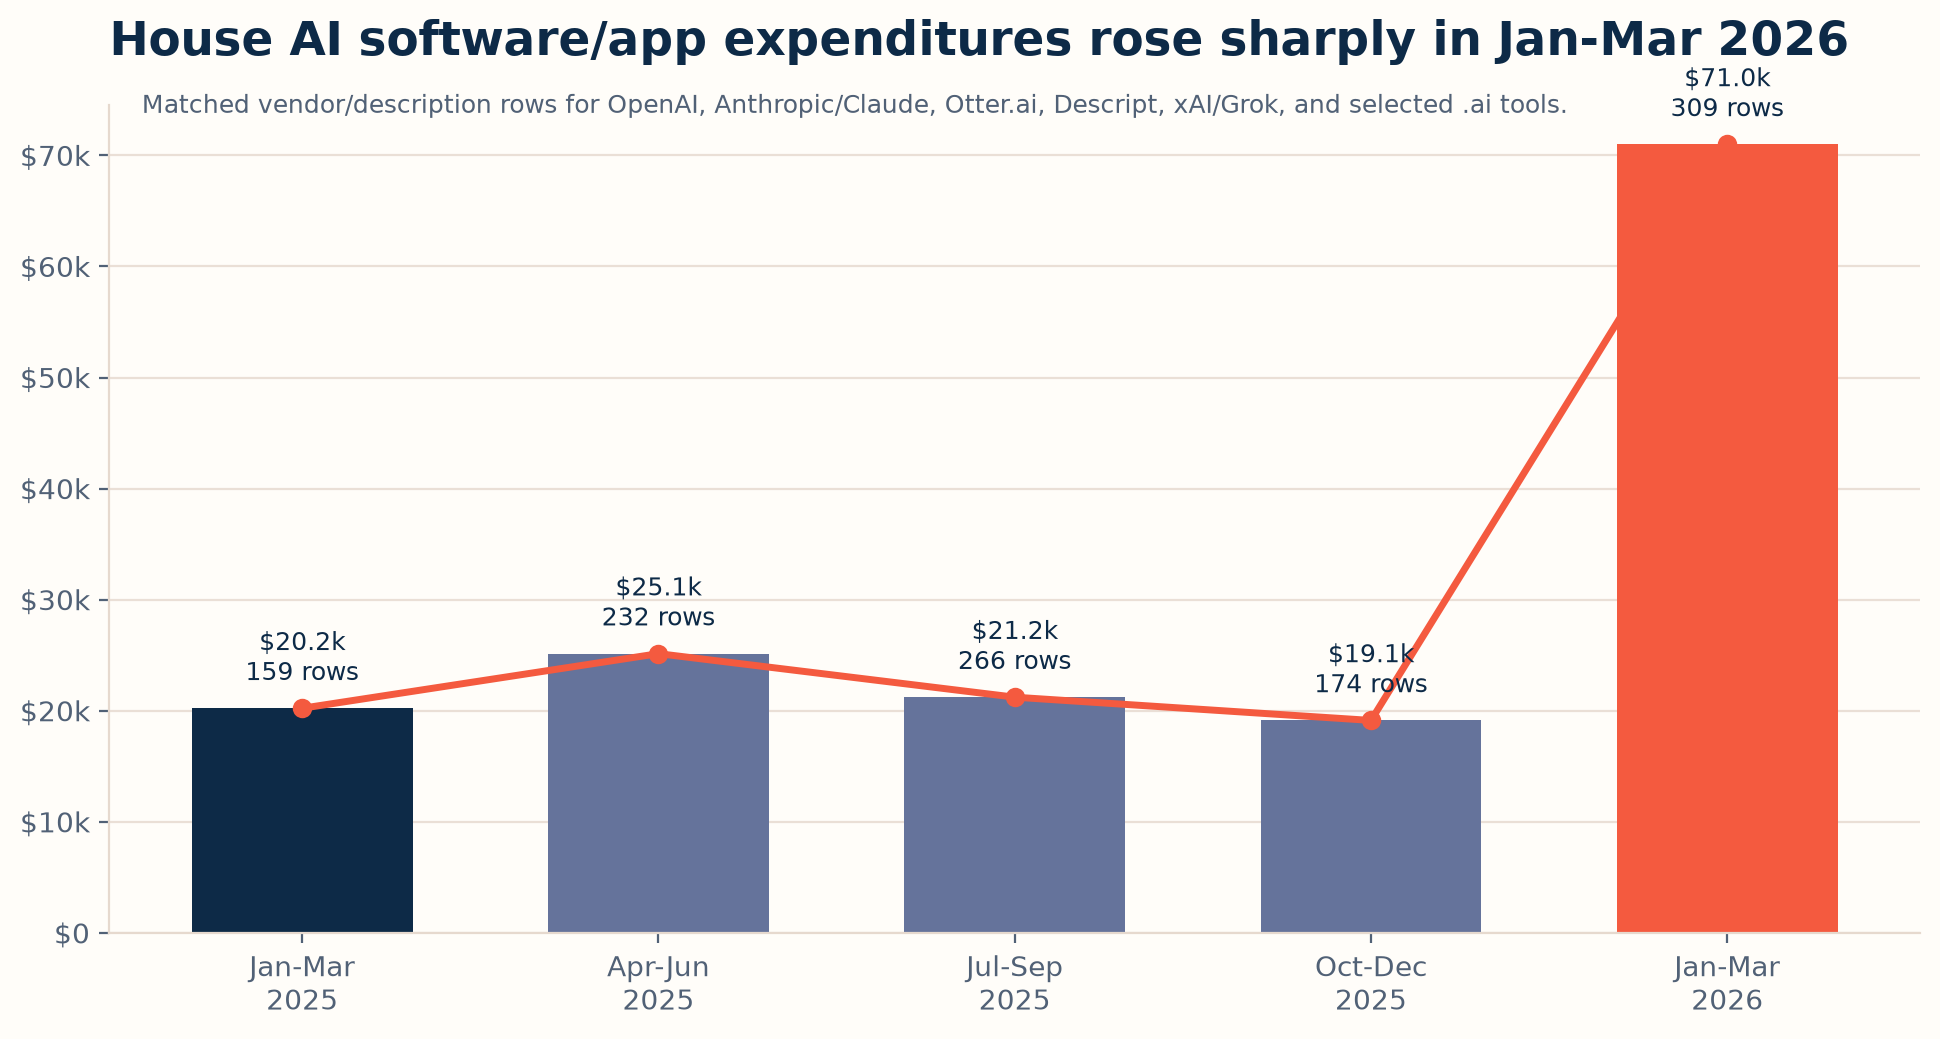
House of Representatives expenditure records show a clear uptick in identifiable AI software and app spending in the first quarter of 2026, led mostly by OpenAI/ChatGPT subscriptions.
The uptick
How this was gathered
This report was generated from POPVOX's refreshed expenditure datasets. For the House, the analysis uses structured Statement of Disbursements detail-grid CSV rows covering Jan-Mar 2025 through Jan-Mar 2026. For the Senate, the current explorer parses PDF reports from the Secretary of the Senate covering Oct. 1, 2024 through Mar. 31, 2026; Senate results are more limited because the source reports are PDF-based.
Original source records
Explore parsed data
This information is made public by the House and Senate, but it is not easily accessible as-is. New AI-enabled tools make it possible for non-coders to more easily parse this information, giving new life to old ideas of open data and open government. We at POPVOX are working to show what is possible with these tools and to continue encouraging public institutions to make their information open and transparent to improve public understanding.
Across the loaded House Statement of Disbursements detail-grid periods from Jan-Mar 2025 through Jan-Mar 2026, matched AI software/app expenditures total $156,692.88. The standout quarter is Jan-Mar 2026, with $70,984.87 across 309 rows.
What is driving it
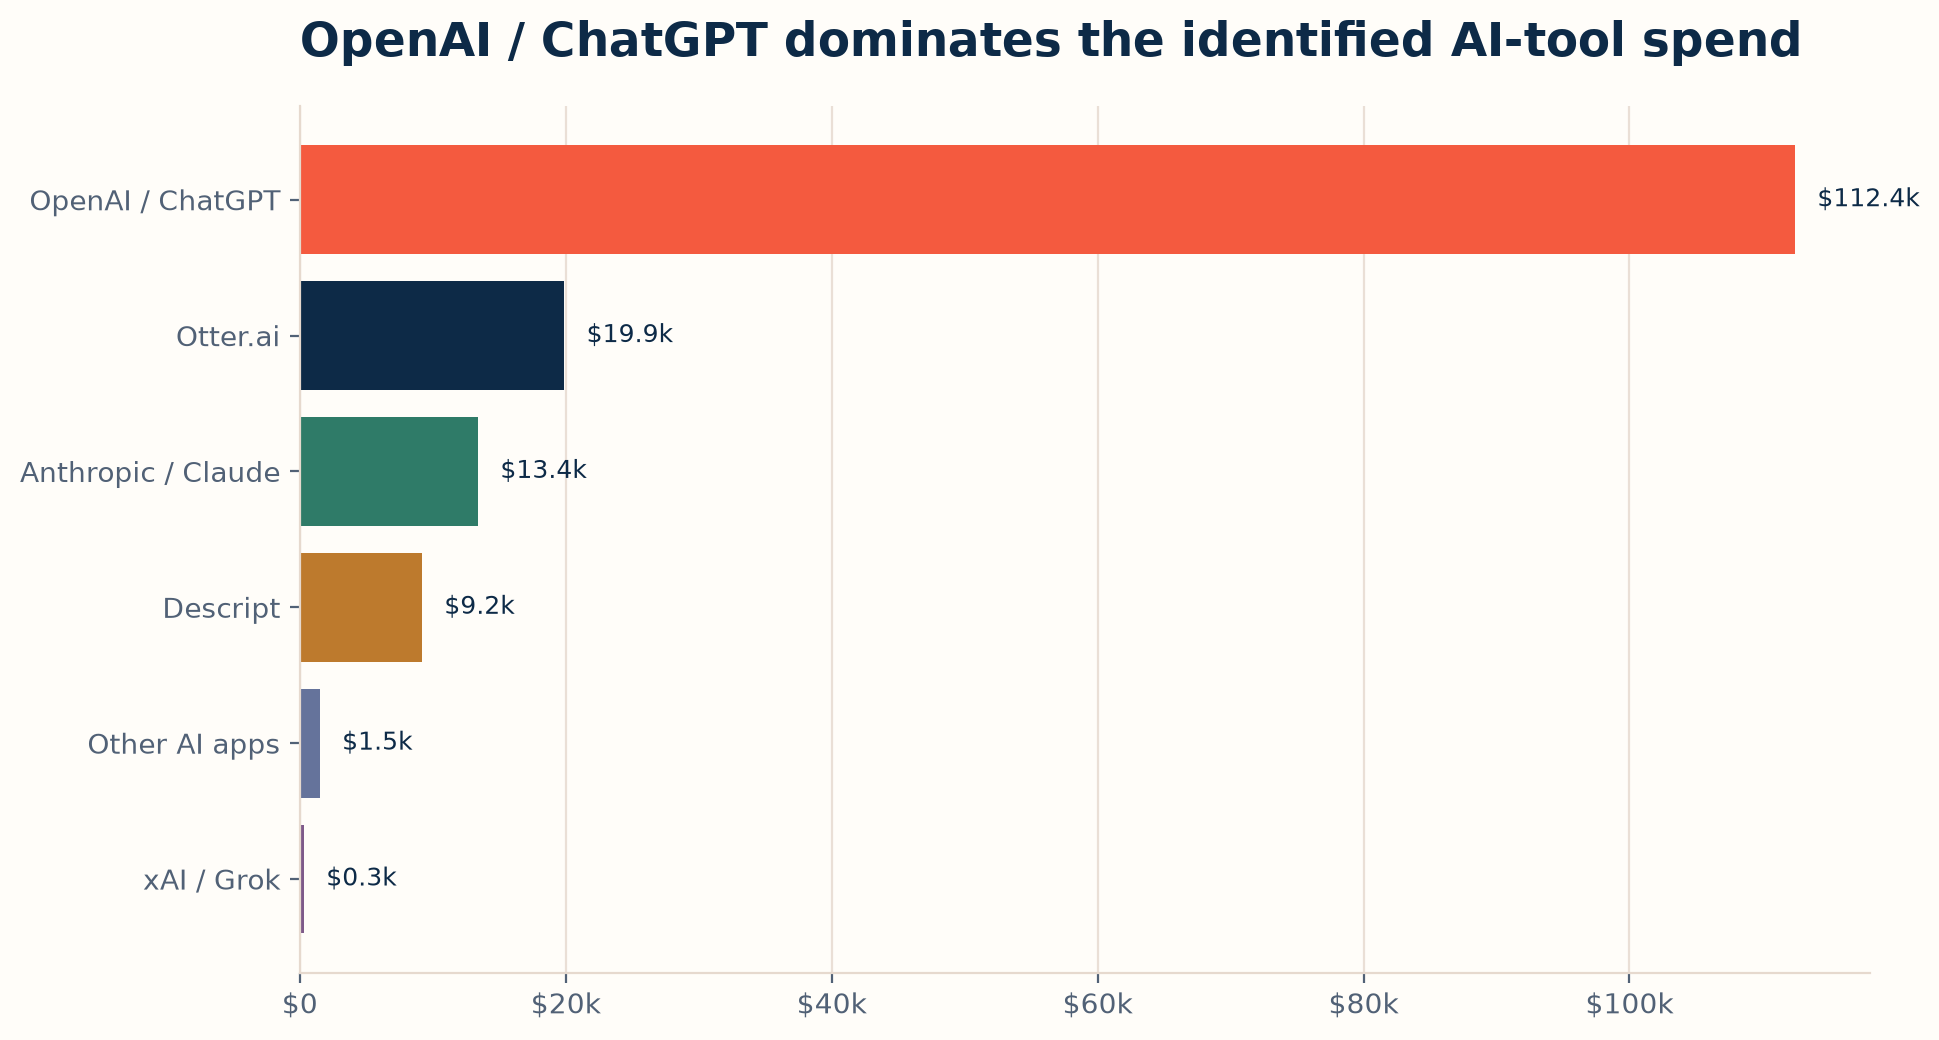
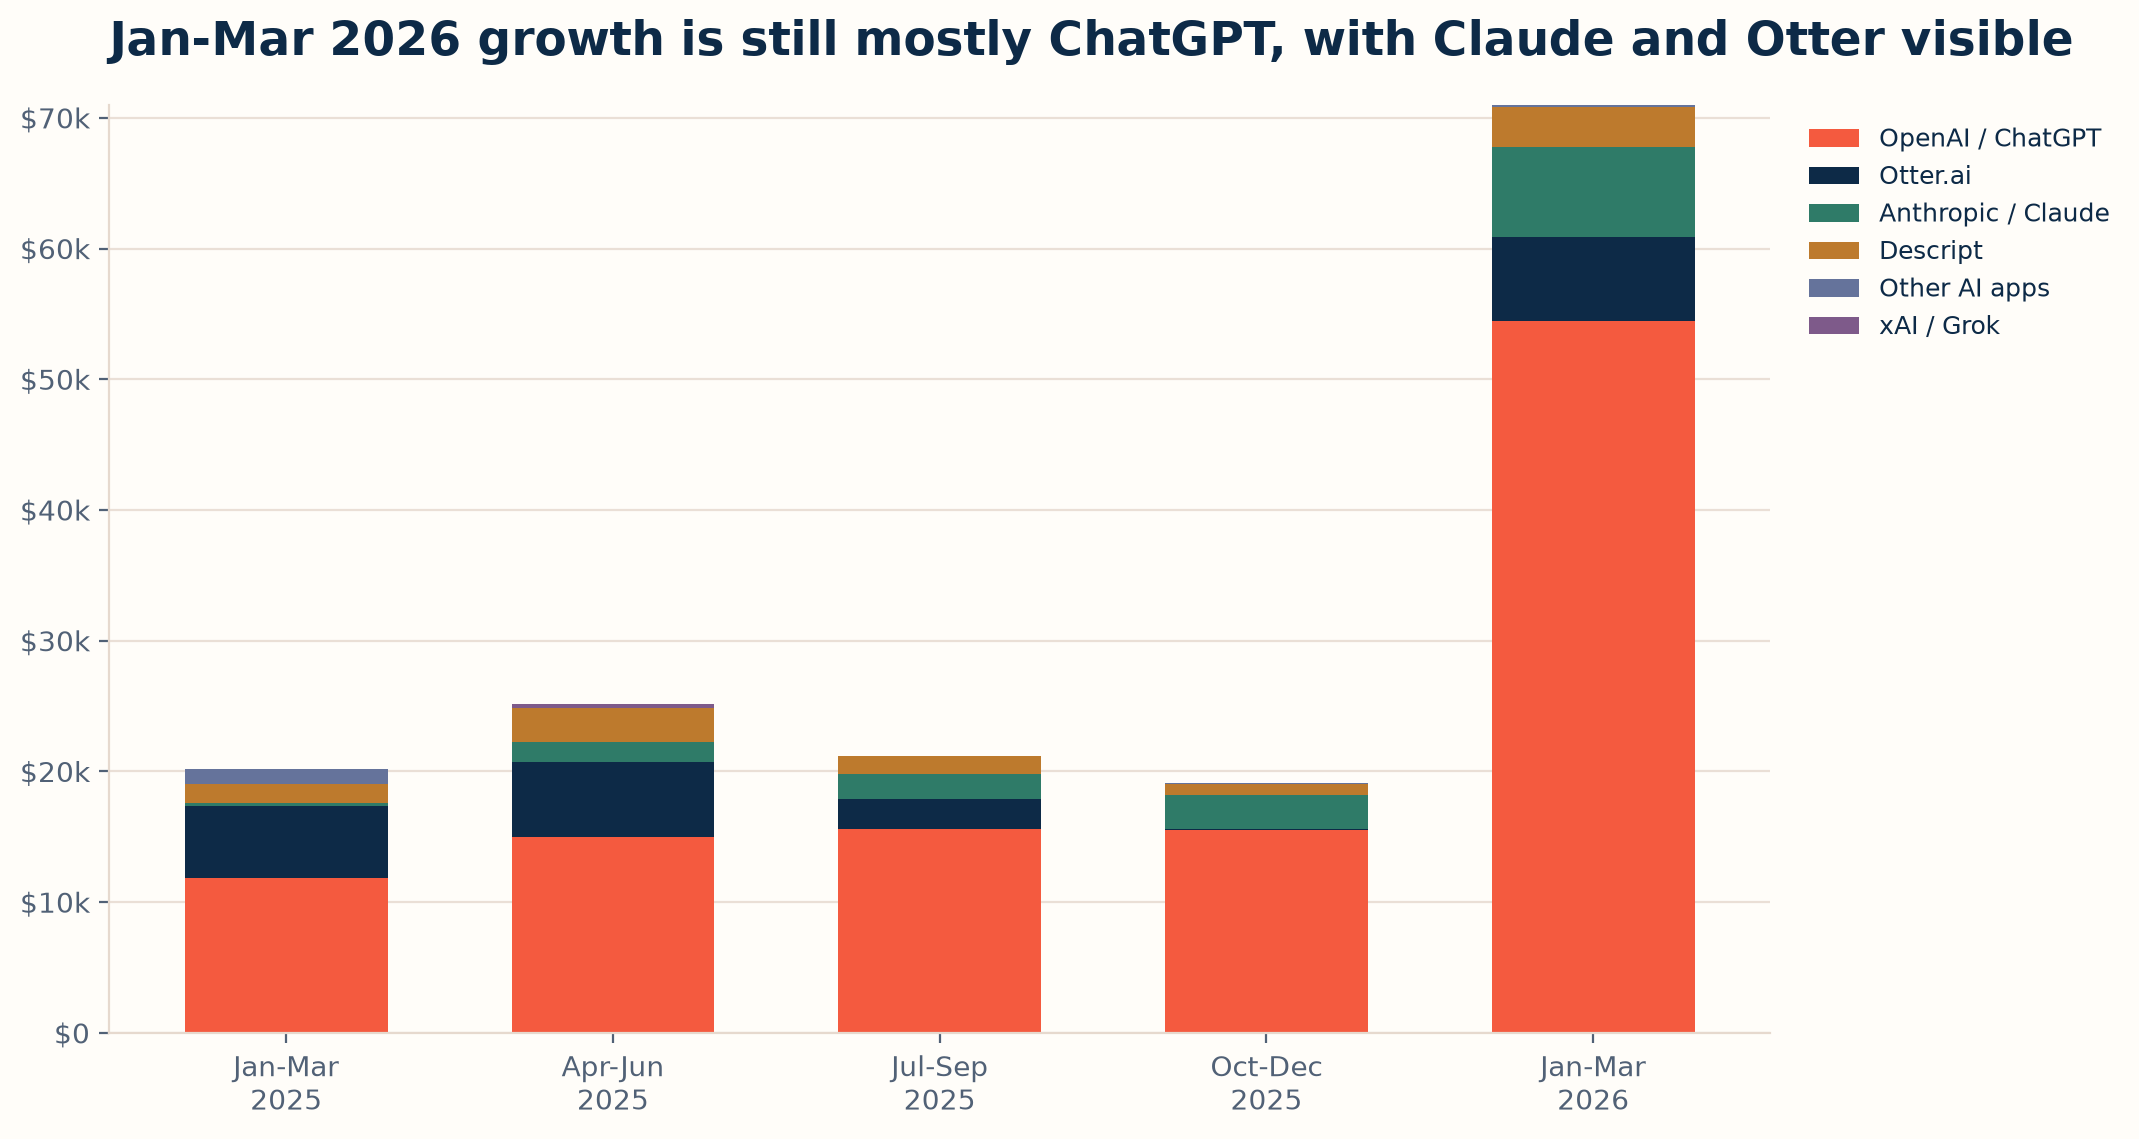
OpenAI/ChatGPT is the largest identified category by a wide margin. Otter.ai and Anthropic/Claude are smaller but visible.
| Category | Amount | Rows |
|---|---|---|
| OpenAI / ChatGPT | $112,442.23 | 916 |
| Otter.ai | $19,882.66 | 87 |
| Anthropic / Claude | $13,395.62 | 38 |
| Descript | $9,179.38 | 91 |
| Other AI apps | $1,492.99 | 7 |
| xAI / Grok | $300.00 | 1 |
Where it appears
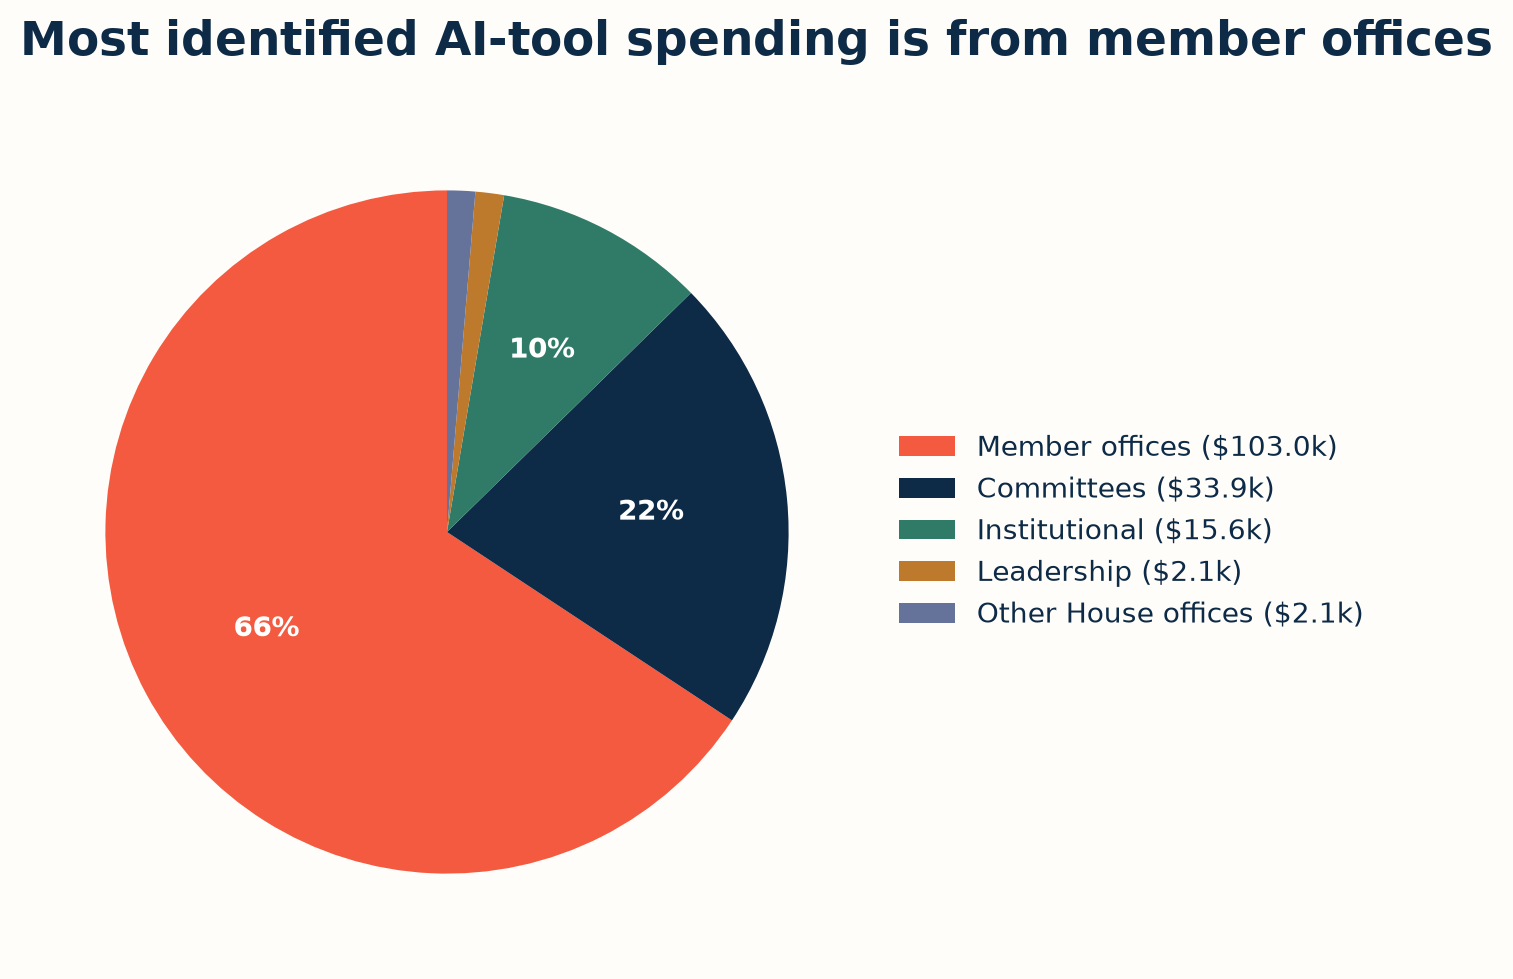
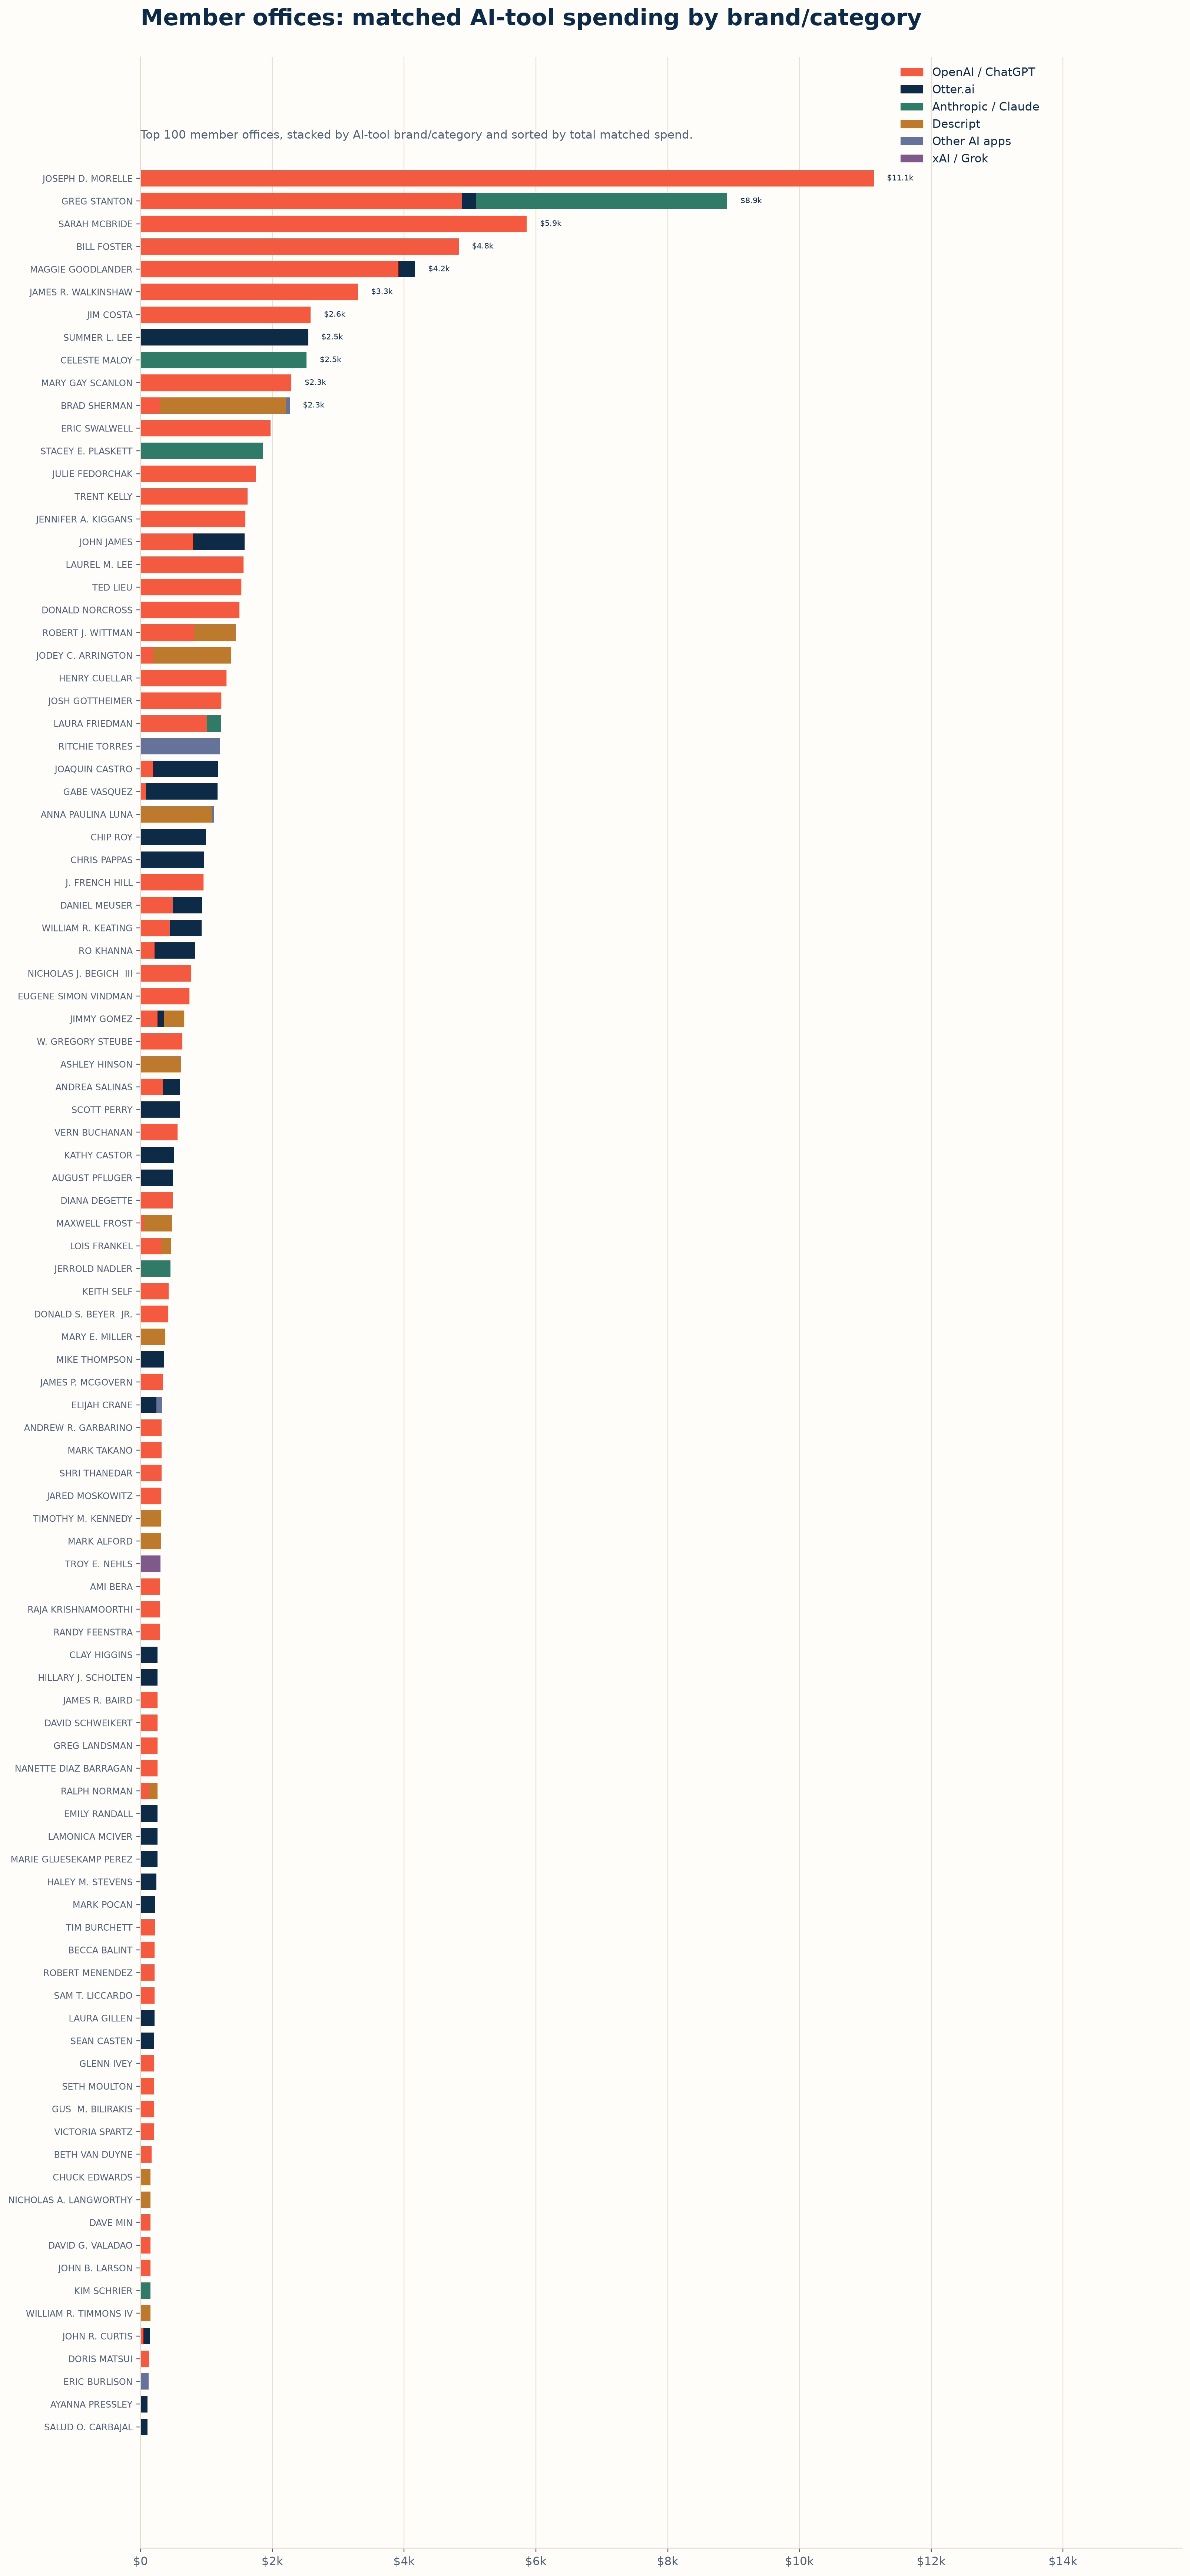
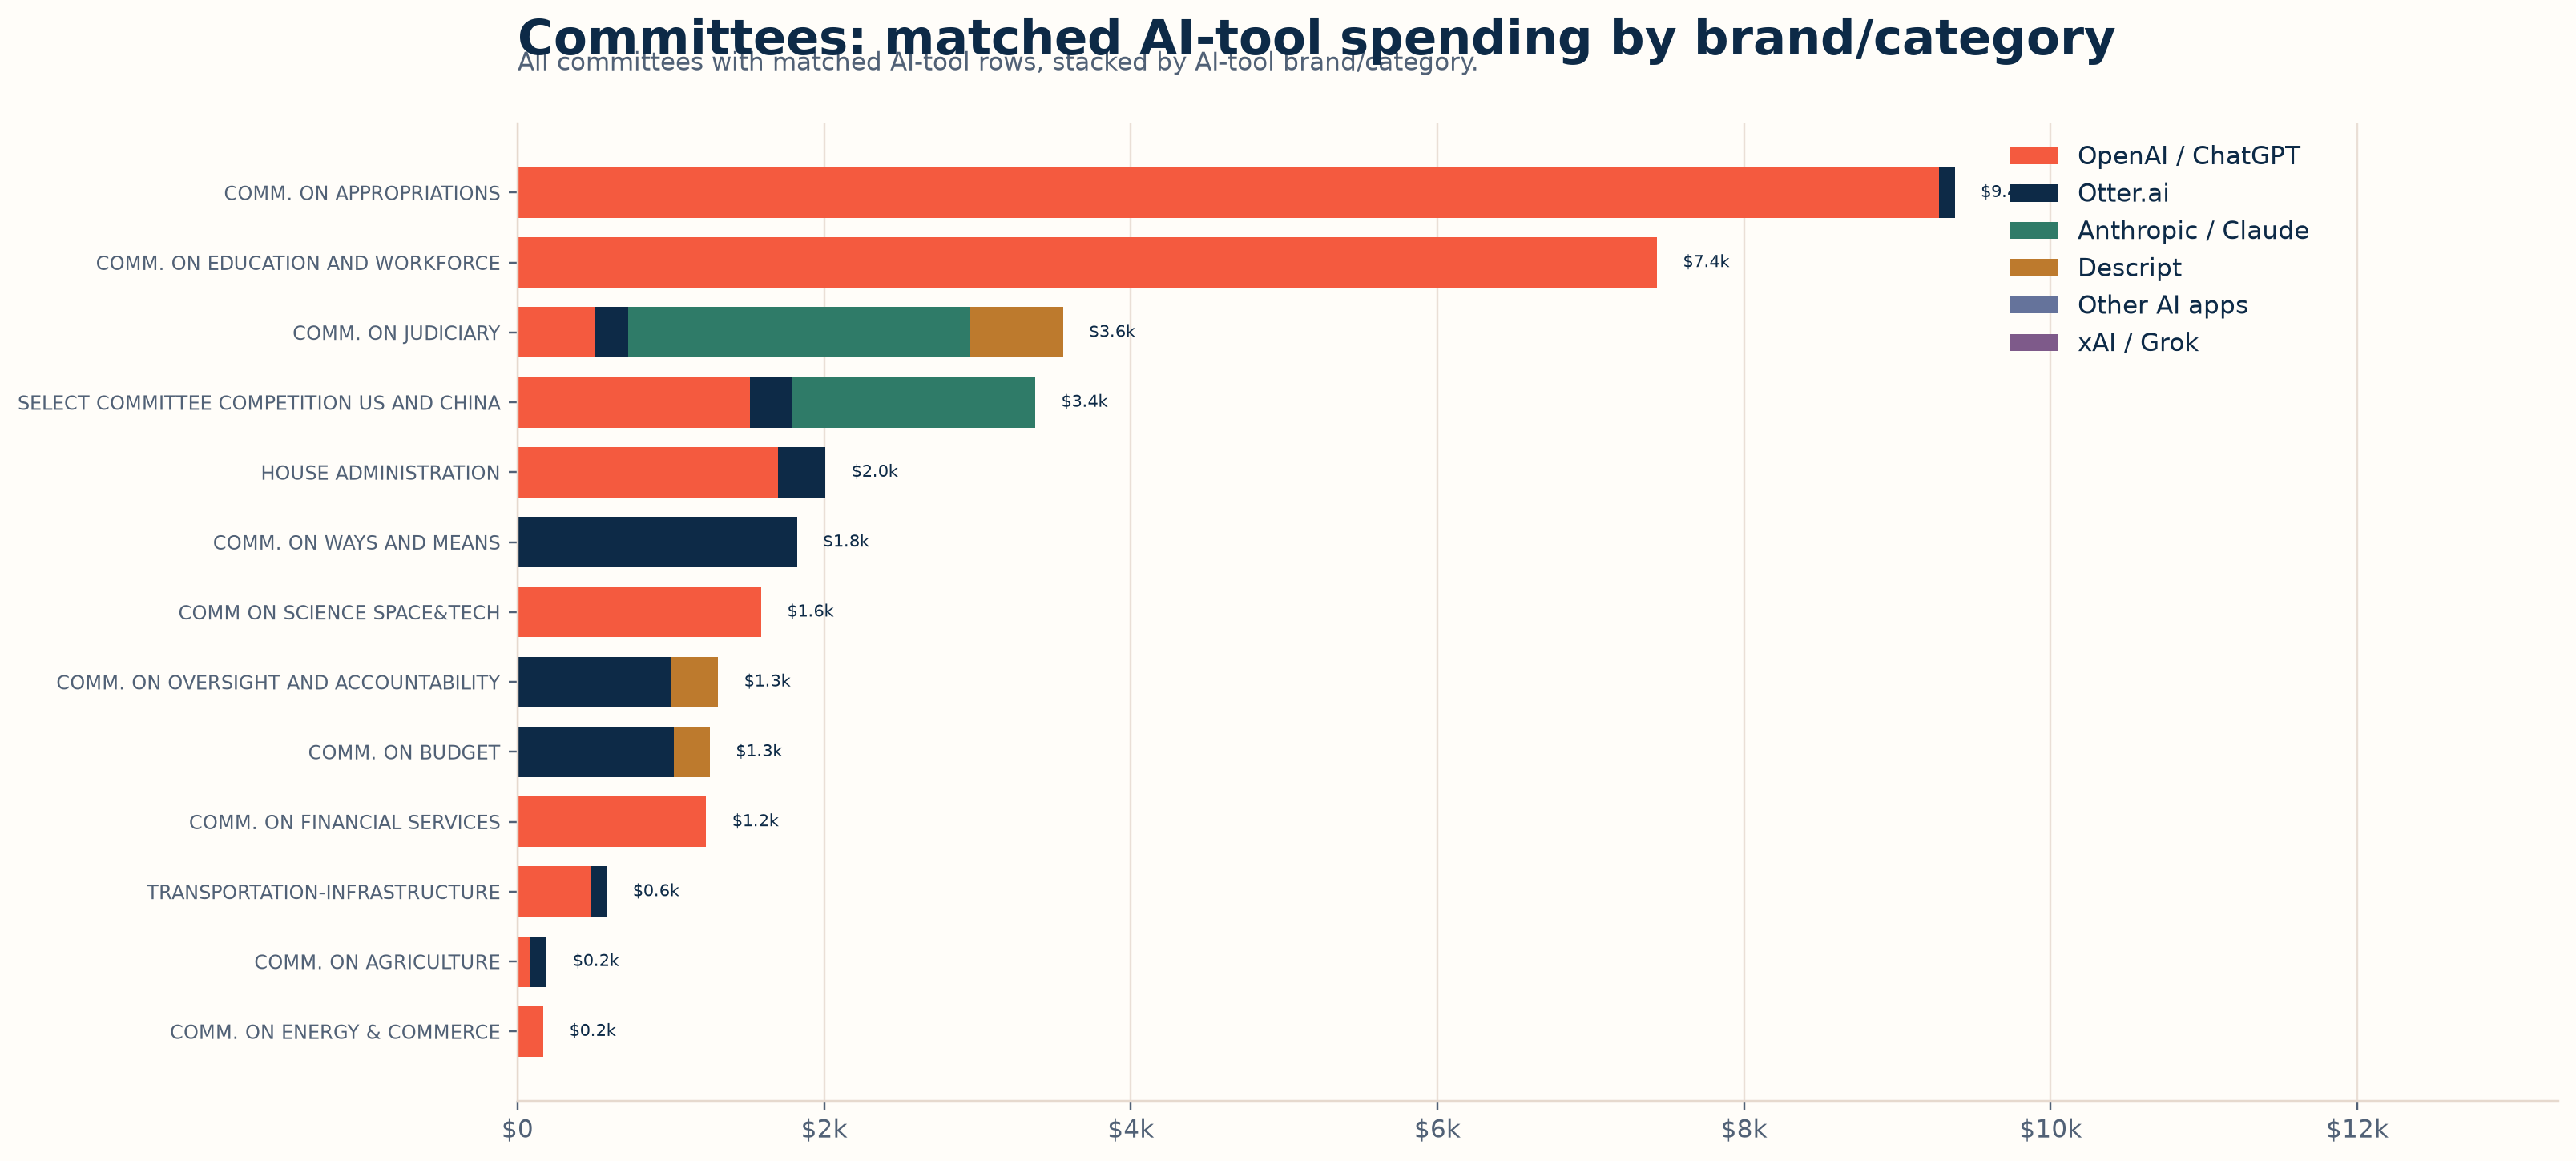
Member offices account for the largest share of identified AI-tool spending: $102,953.45, or about two-thirds of the matched total. Committees account for $33,902.08.
Broader data vendors are different
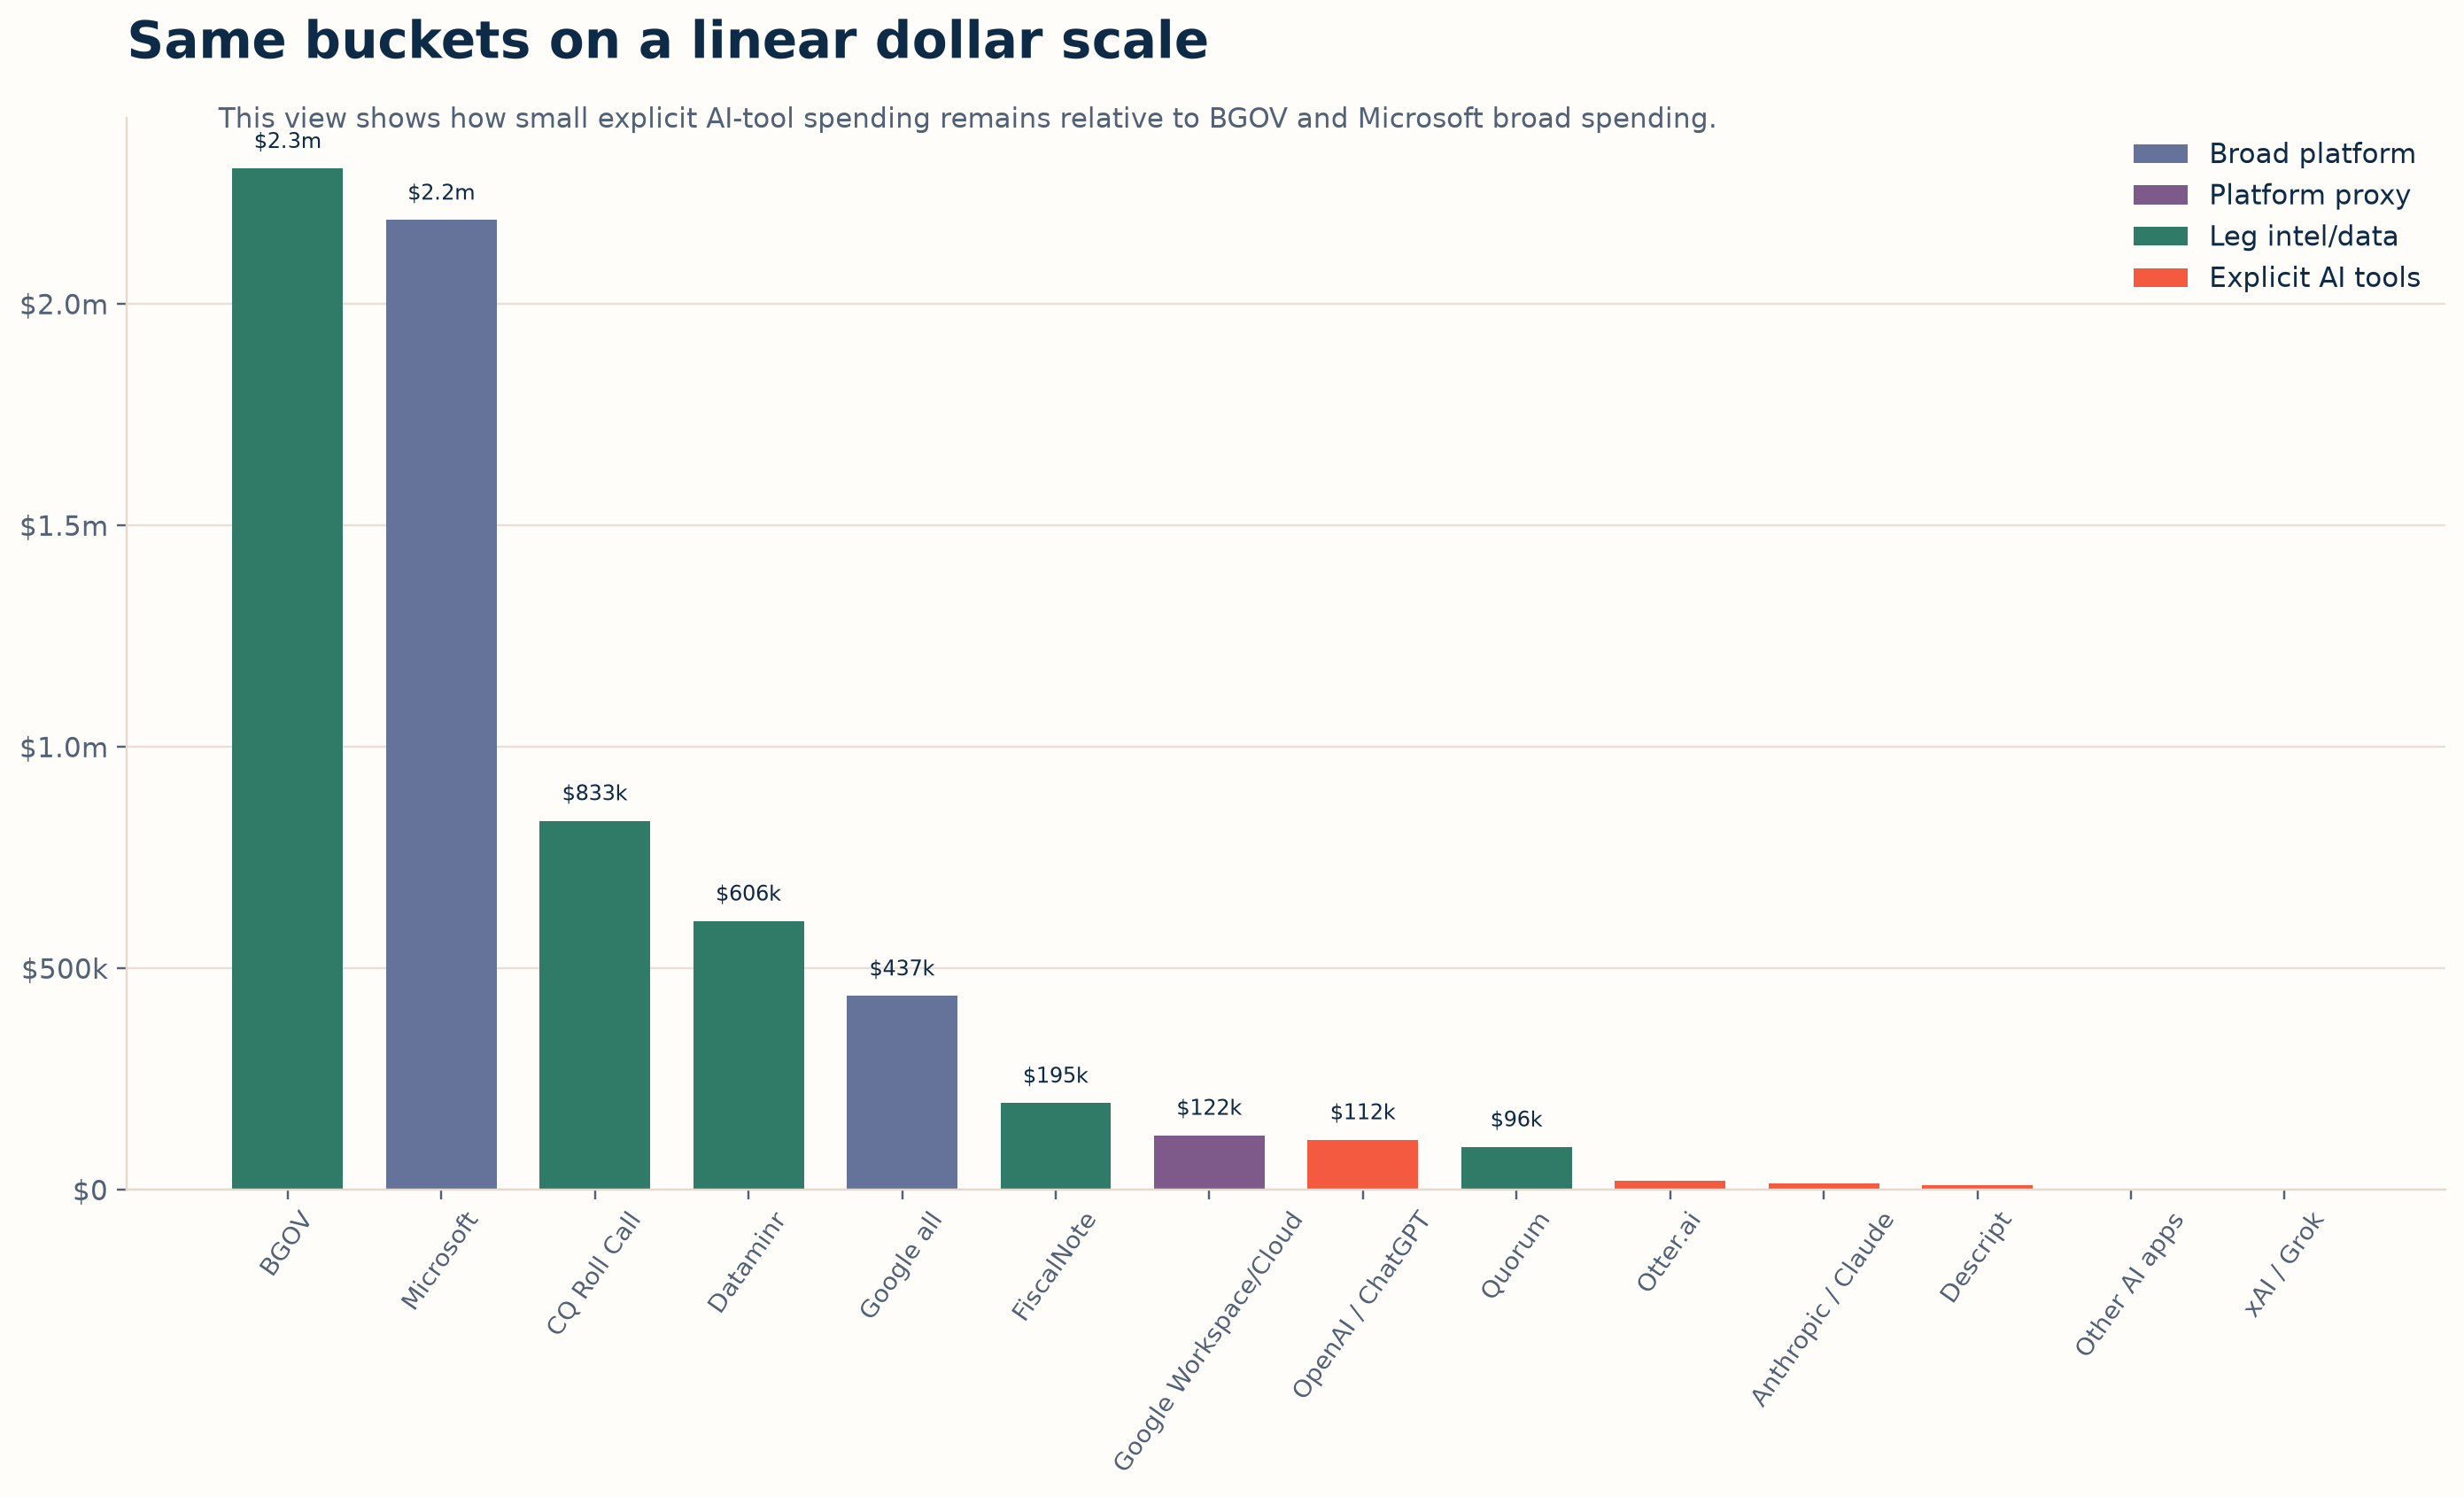
The AI-tool signal is meaningful, but it is still small compared with broader legislative-intelligence, data, and platform vendors such as BGOV, Microsoft, CQ Roll Call, Dataminr, FiscalNote, and Quorum. Those broader vendors total about $6.21 million across the same loaded House periods.
This broader category should not be treated as AI adoption. It is a comparator because some products may add AI features over time, but the expenditure rows generally do not isolate AI-enabled functionality inside a broader subscription.
The chart below puts broad platform spending, Google ecosystem spending, legislative-intelligence vendors, and explicit AI-tool vendors on one scale. It uses a log scale so smaller explicit AI-tool categories remain visible next to million-dollar vendor buckets.
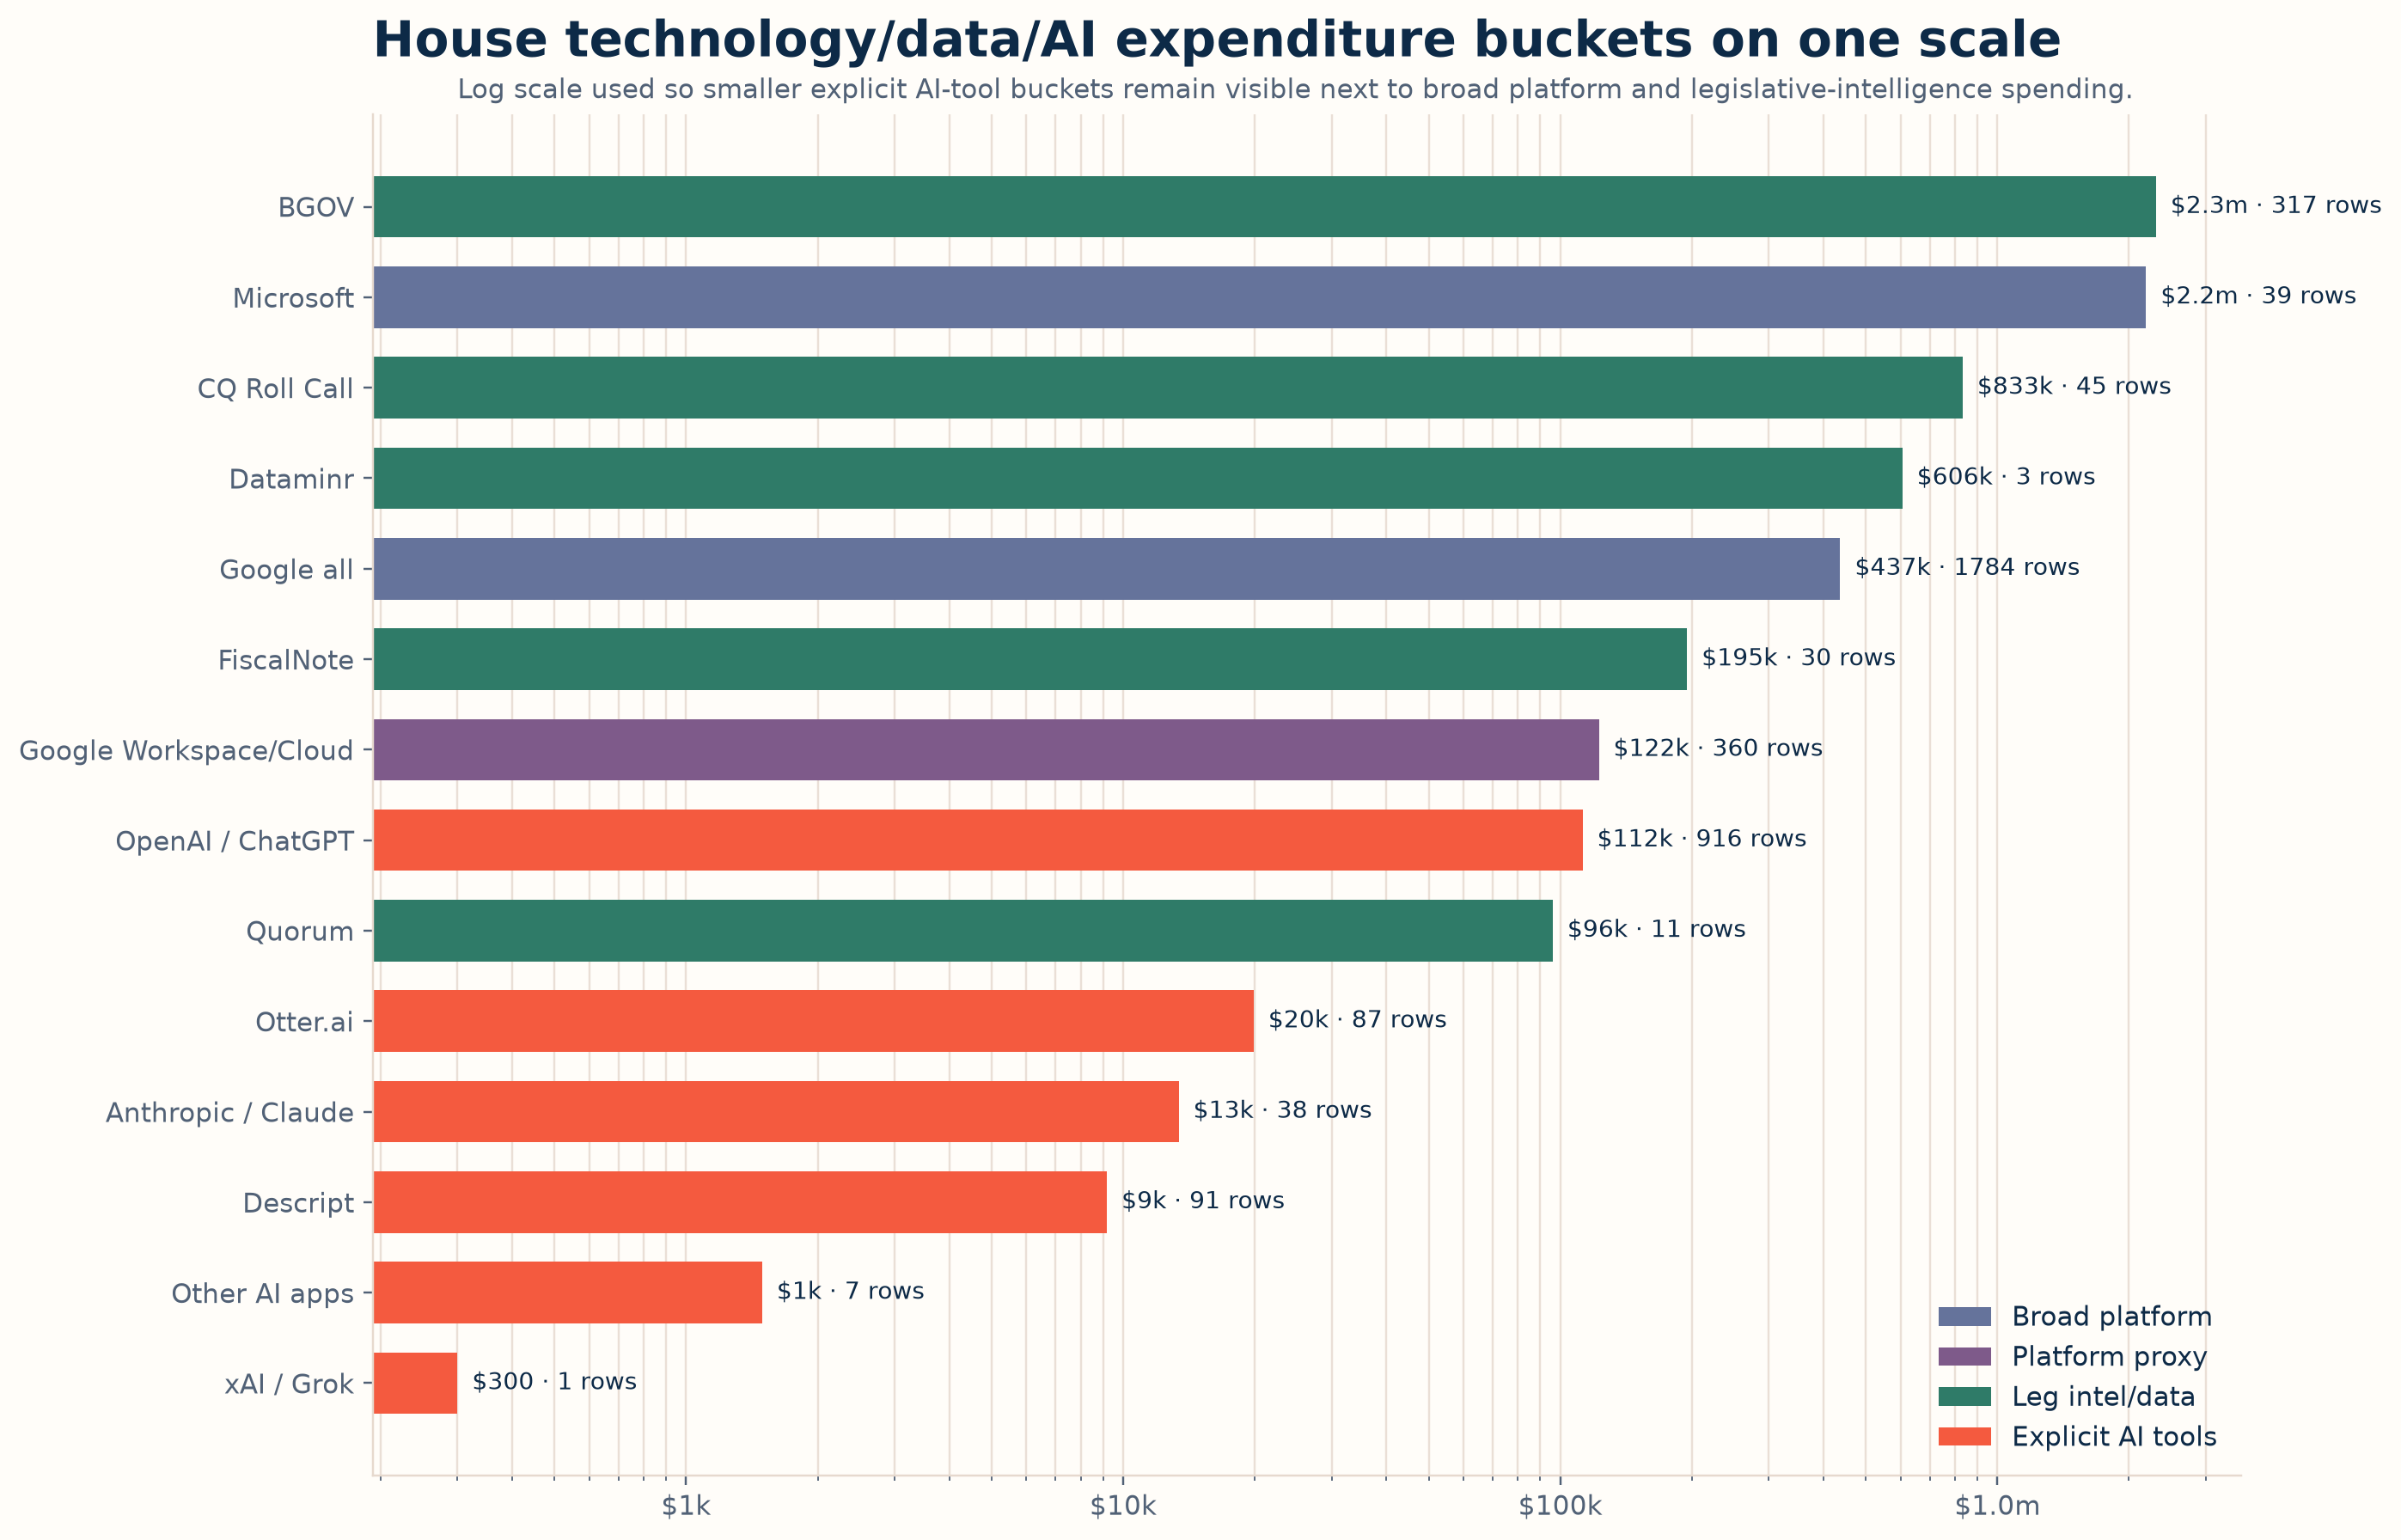
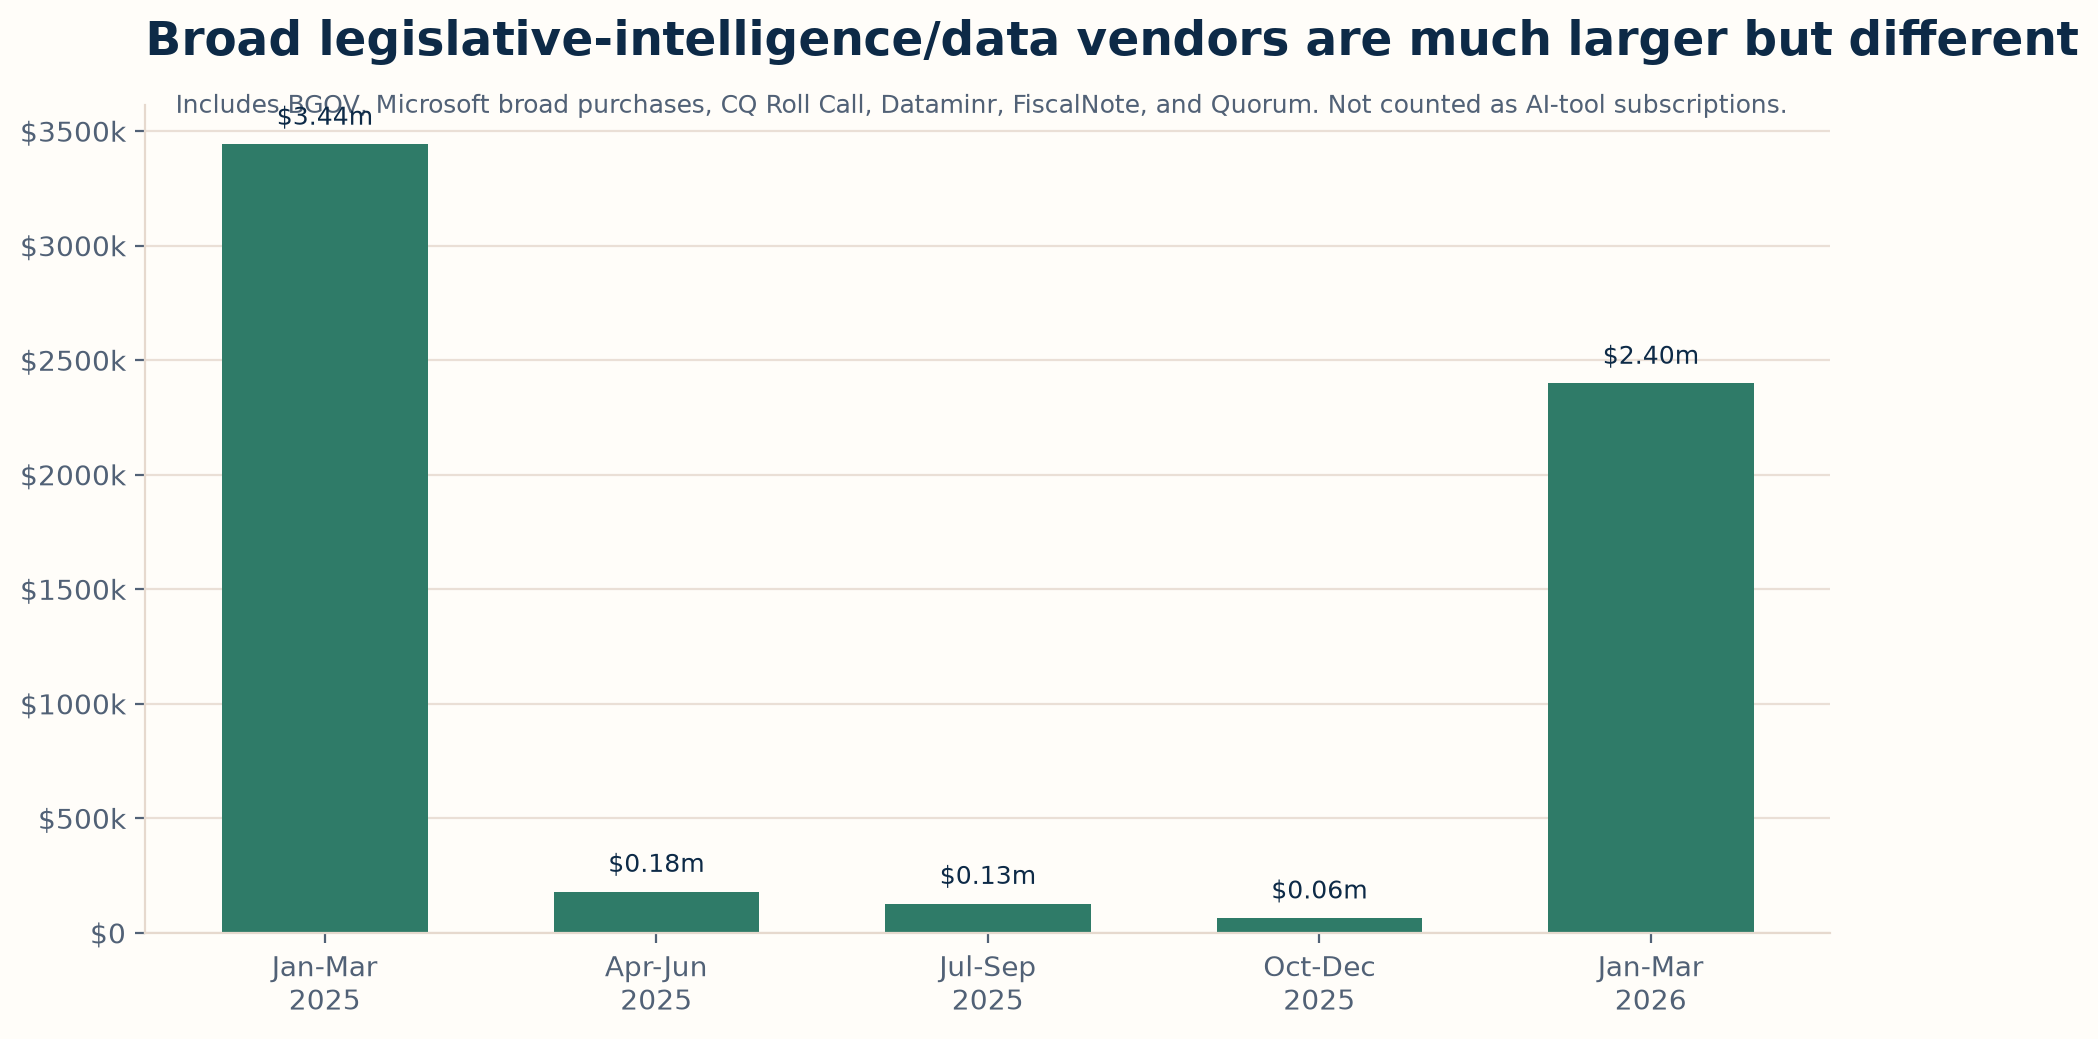
The Jan-Mar spikes in this broad vendor chart should be read as expenditure timing, not necessarily same-quarter usage. Some offices and institutional buyers may pay once for an annual subscription early in the year.
Senate signal
The refreshed Senate disbursement data covers Oct. 1, 2024-Mar. 31, 2025; Apr. 1-Sep. 30, 2025; and Oct. 1, 2025-Mar. 31, 2026. In the current Senate aggregate/sample data, this scan did not identify explicit OpenAI, ChatGPT, Anthropic, Claude, Otter.ai, xAI/Grok, Perplexity, Copilot, or Descript vendor matches. The only broad legislative-intelligence match was BGOV LLC, totaling $13,176 across two rows.
This does not prove the Senate is not using AI tools. It means the currently parsed Senate output does not expose those vendors in the aggregate/sample structure we are using.
Policy context: Microsoft Copilot
House AI guidance and implementation details are partly internal, so expenditure rows should not be treated as a complete map of approved or available tools. POPVOX Foundation reporting on House and Senate AI policies notes that Microsoft Copilot is on the House approved list and that a House-wide rollout of roughly 6,000 one-year Copilot licenses is underway. The House Administration Committee's AI Flash Report also described CAO testing of Office365 Copilot and Microsoft Azure OpenAI Service in 2024.
Centrally procured or no-new-expense Copilot access may not appear as direct office-level spending. In this dataset, no expenditure row names Copilot directly.
| Microsoft-related measure | Amount | Rows | Interpretation |
|---|---|---|---|
| Explicit Copilot rows | $0.00 | 0 | No row names Copilot directly. |
| All Microsoft-labeled rows | $2,188,576.07 | 39 | Broad Microsoft ecosystem spending. |
| MICROSOFT CORP under CAO | $2,178,031.84 | 6 | Best candidate bucket for centralized Microsoft enterprise spending, but row descriptions are generic. |
The MICROSOFT CORP rows appear under Chief Administrative Officer of the House and use descriptions such as NON-TECHNOLOGY SERVICE CONTR, COMPUTER SOFTW PURCH LESS THAN $10,000, and MAINTENANCE / REPAIRS. Those rows should not be counted as Copilot spending without additional procurement detail.
Policy context: Google Workspace and Gemini
POPVOX Foundation reporting on House and Senate AI policies notes that Google Gemini is approved for House and Senate use through Google Workspace. At the same time, Google Workspace, Gmail, and Docs are not the House's official enterprise productivity baseline in the same way Microsoft 365 is; many offices nevertheless appear to use Google services in practice.
Google ecosystem spending can appear in office records without proving Gemini use. The expenditure data does not show reliable Gemini spending.
| Google-related measure | Amount | Rows | Interpretation |
|---|---|---|---|
| Clean Gemini rows | $0.00 | 0 | No reliable Gemini expenditure rows. |
| Raw Gemini false positive | $63.75 | 1 | SQ GEMINI HAPPY ICE food/beverage row, excluded. |
| Google Workspace / GSuite / Cloud proxy | $122,492.27 | 360 | Best Google-suite proxy after excluding Google Ads, YouTube, and false positives. |
| All Google-labeled rows | $436,964.05 | 1,784 | Broad Google ecosystem spending, including Ads and YouTube. |
Google Workspace / GSuite / Cloud proxy by loaded period
| Period | Amount | Rows |
|---|---|---|
| Jan-Mar 2025 | $25,697.28 | 76 |
| Apr-Jun 2025 | $25,883.12 | 80 |
| Jul-Sep 2025 | $21,130.55 | 79 |
| Oct-Dec 2025 | $14,259.28 | 42 |
| Jan-Mar 2026 | $35,522.04 | 83 |
This should be read as possible Google ecosystem exposure, not Gemini adoption. The row text does not identify Gemini.